Project 4: Data Analysis
Objective
The primary objective of this dashboard is to analyze and monitor pizza restaurant sales performance across multiple dimensions, such as item category, individual item name, time of day, and geographic location. This analysis helps stakeholders understand customer behavior, popular menu items, and peak ordering hours, enabling data-driven decisions to enhance operations, marketing, and inventory planning. Additionally, the dashboard aims to compare delivery versus pickup preferences, providing insights into customer fulfillment methods. This can help streamline delivery logistics and improve customer service strategies tailored to order types.
Read MoreProcess
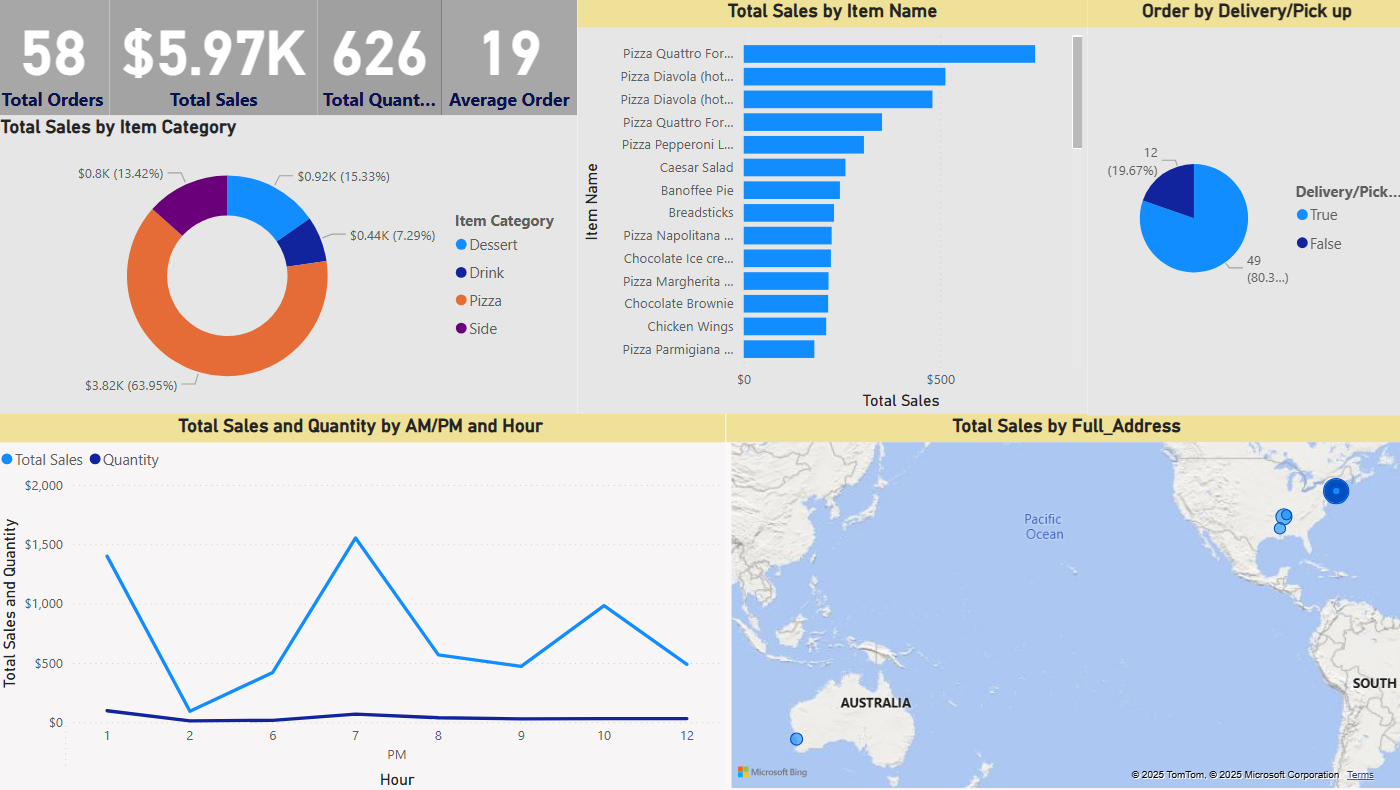
The data originates from point-of-sale systems capturing details of each order, including item names, sales amounts, timestamps, order types, and customer addresses. This data is processed, categorized, and visualized using Power BI, allowing interactive exploration of key metrics like total sales, item popularity, and sales by location or time. Visuals include a donut chart for category breakdown, a bar graph for item-level sales, a line chart for time-based trends, a pie chart for order types, and a map for geographic sales distribution. These visuals work together to provide a holistic view of business performance in a user-friendly format.
Findings
The highest contribution to total sales comes from the Pizza category, accounting for 63.95% of total revenue, followed by Dessert and Sides. Among individual items, "Pizza Quattro Formaggi" leads in total sales, highlighting a strong customer preference. Additionally, 80% of orders are deliveries, showing a clear lean towards convenience services. From the time analysis, sales peak in the evening around 7 PM and 10 PM, suggesting optimal hours for staffing and promotions. Geographically, most sales are concentrated in North America, with notable activity in the eastern U.S. and one marker in Australia, possibly indicating international or outlier orders.
Conclusion
This analysis confirms that pizza is the primary revenue driver, and focusing marketing or upsell strategies around top-performing items like "Pizza Quattro Formaggi" could maximize profits. Delivery dominates as the preferred fulfillment method, indicating a potential need to optimize delivery operations for speed and customer satisfaction.
In conclusion, the business benefits from a clear understanding of time-based sales peaks, item-level performance, and delivery patterns. These insights can inform targeted decision-making for menu optimization, staffing schedules, and regional marketing strategies to further boost profitability.
Recommendations
- Focus Promotions on Best-Selling Items: Leverage the popularity of top items like Pizza Quattro Formaggi and Pizza Diavola by bundling them with drinks or desserts in combo deals. Promote these during peak hours (7 PM & 10 PM) to boost ticket size.
- Optimize Delivery Operations: With over 80% of orders being deliveries, invest in improving delivery speed and reliability. Consider partnerships with third-party delivery services, dynamic delivery zones, or real-time tracking to enhance customer experience.
- Time-Based Marketing Campaigns: Run AM/PM-based promotions or “Happy Hour” deals during off-peak times (like 2–5 PM) to increase sales when volume is low. Use SMS, app push notifications, or email campaigns targeted to customer behavior patterns.
- Expand Pizza Category Innovation: As Pizza generates ~64% of sales, introduce limited-time flavors or seasonal offerings to test new preferences. Monitor item-level sales closely to determine what sticks and remove underperformers.
- Geographic Targeting: Since most sales are in North America, focus digital advertising and loyalty rewards programs in these hot zones. If the marker in Australia indicates expansion potential, conduct a regional market analysis for future franchise opportunities.
- Incentivize Pickup Orders: With only 20% of customers choosing pickup, offer discounts or faster order prep times for those who opt in. This could reduce delivery strain and increase customer options.
- Enhance Dessert & Side Sales: These lower-performing categories could be uplifted by bundling or upselling tactics. Use suggestive selling in the app or at checkout to recommend a dessert or side with each order.
Pictures