Project 3: Business Case Analysis
Objective
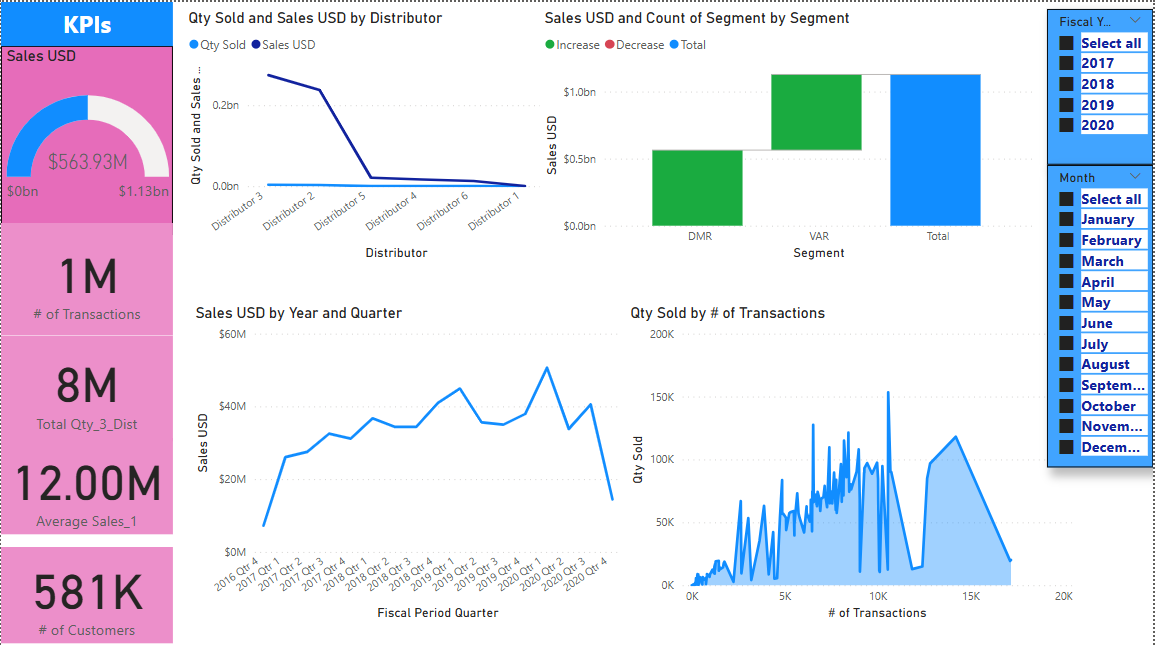
The objective of this dashboard is to provide a comprehensive overview of the sales performance for StarTech products, analyzed across key dimensions such as time (year and quarter), customer transactions, distribution channels, and sales segments. By doing so, it supports strategic decision-making and performance monitoring for executives, sales managers, and operations leaders. This visualization helps identify trends, distribution efficiency, customer engagement, and segment growth over time. The filters on fiscal year and month further allow users to drill down into specific timeframes, enabling deeper insights into seasonal patterns and yearly comparisons.
Read MoreProcess
The dashboard aggregates transactional and sales data from various distributors and customer interactions. It likely utilizes ETL processes to clean, transform, and load data from multiple source systems into a central repository for analysis. Power BI is then used to model the data and create dynamic visualizations. The KPIs on the left are calculated measures, providing high-level metrics such as total sales USD, number of transactions, and customer count. These are supported by detailed trend charts and bar graphs that correlate sales with distributors, segments, time periods, and transaction volumes, offering both macro and micro-level insights.
Findings
The total sales value stands at $563.93M from 1 million transactions and over 581K customers. A significant volume of sales is concentrated among a few top distributors, while others show minimal performance. The VAR segment outperforms the DMR segment in both sales and growth, indicating stronger market penetration or customer loyalty in that area. Additionally, quarterly sales peaked around Q4 2019 but have declined since, suggesting either market saturation, seasonality, or external factors affecting demand. The positive correlation between the number of transactions and quantity sold confirms that transaction volume is a key driver of sales performance.
Conclusion
The sales trajectory, especially the drop in 2020 Q4, indicates a need for proactive strategies to stabilize and revitalize revenue streams. High-performing distributors and the VAR segment should be reinforced through incentives, marketing efforts, or capacity building to maintain momentum.
Moving forward, the company should investigate reasons behind the dip in recent quarters, assess customer behavior trends, and optimize distributor relationships. Targeted campaigns, operational refinements, and possibly geographic or segmental expansion could help reverse downward trends and enhance profitability.
Recommendations
- Prioritize high-performing distributors: Allocate more resources, marketing support, and exclusive deals to Distributor 3 and Distributor 2, who drive the majority of sales.
- Revitalize Q4 performance: Launch targeted end-of-year promotions or bundled offers to address the clear drop-off in sales during this period.
- Expand the VAR segment: Analyze its success factors and replicate them in underperforming areas or segments like DMR.
- Launch loyalty or referral programs: Leverage the large customer base (581K) to stimulate transaction frequency and customer retention.
- Investigate transaction drop zones: Review customer behavior or service issues that might have caused sudden dips in transaction volume post-2019.
Pictures