Project 2: Process Modelling
About Flow Chart
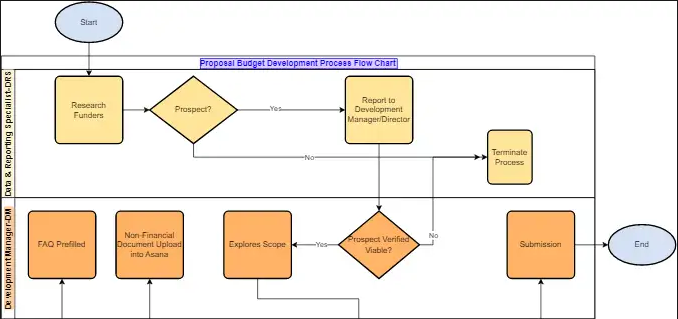
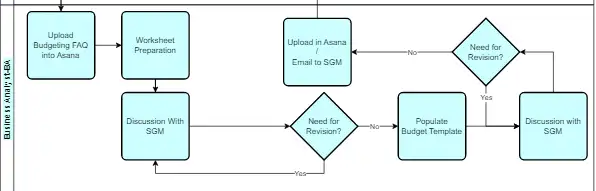
This process flow chart outlines the steps involved in the preparation, review, and approval of a proposal within an organization.
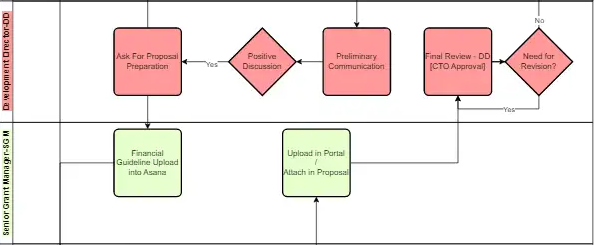
The chart is divided into three main sections: Development Director (DD), Senior Grant Manager (SGM), and Business Analyst/SGM. The process begins with the Development Director initiating the proposal preparation. If the discussion results in approval, preliminary communication with the funder takes place, followed by a final review and CTO approval. If revisions are necessary, the process loops back for adjustments before progressing further.
The Senior Grant Manager plays a crucial role by uploading financial guidelines into Asana and attaching the proposal to the portal. Meanwhile, the Business Analyst/SGM is responsible for uploading budgeting FAQs into Asana, preparing worksheets, drafting budgets, and refining them in discussion with the SGM.
Once a draft budget is ready, it is uploaded into Asana and shared via email with the SGM for feedback. If modifications are required, the budget template is updated accordingly, and further discussions take place before finalizing and archiving the worksheet. This structured workflow ensures efficient collaboration and documentation throughout the proposal process.
Pictures
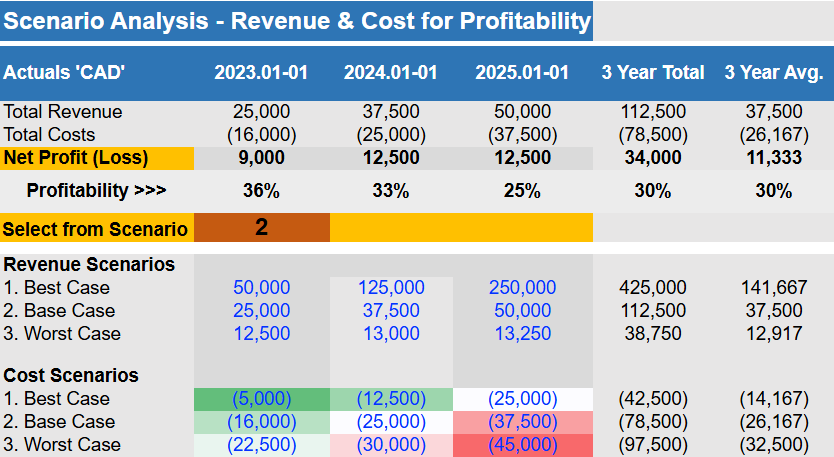
Objective: Scenario Modelling
The objective of this scenario analysis is to evaluate potential financial outcomes for a business over a three-year period (2023-2025). By analyzing various revenue and cost scenarios, the aim is to determine how different financial conditions impact net profit and profitability percentages. This assessment provides insights into the best, base, and worst-case scenarios, enabling informed decision-making regarding future strategies and operations.
Read MoreProcess
The process involves calculating total revenue, total costs, net profit (loss), and profitability percentages for each year using different revenue and cost projections. The analysis incorporates multiple scenarios to assess how financial outcomes change under varying circumstances. Additionally, the 3-year total and 3-year average metrics help provide a broader perspective on long-term profitability and financial sustainability.
Findings
The findings reveal that profitability fluctuates significantly based on revenue and cost variations. For instance, in the base case scenario, the net profit increases from CAD 9,000 in 2023 to CAD 12,500 in both 2024 and 2025, with profitability percentages gradually decreasing from 36% to 25% over the three years. The worst-case scenario presents a financial risk, demonstrating the importance of cost control and revenue optimization in maintaining profitability. Conclusion: The scenario analysis underscores the significance of strategic financial planning. It highlights that while the business can achieve positive profitability under certain conditions, there are risks associated with fluctuating costs and revenue streams. Understanding these variations allows the business to anticipate challenges, optimize financial decisions, and improve overall stability. Recommendation: To enhance profitability, it is recommended that the business closely monitors its revenue streams and cost structure. Implementing cost-efficiency measures and exploring ways to increase revenue—especially in uncertain market conditions—would be beneficial. Additionally, periodic updates to the scenario analysis will help ensure alignment with evolving financial realities and market trends, fostering informed decision-making.
Conclusion
The scenario analysis underscores the significance of strategic financial planning. It highlights that while the business can achieve positive profitability under certain conditions, there are risks associated with fluctuating costs and revenue streams. Understanding these variations allows the business to anticipate challenges, optimize financial decisions, and improve overall stability.
Recommendation
To enhance profitability, it is recommended that the business closely monitors its revenue streams and cost structure. Implementing cost-efficiency measures and exploring ways to increase revenue—especially in uncertain market conditions—would be beneficial. Additionally, periodic updates to the scenario analysis will help ensure alignment with evolving financial realities and market trends, fostering informed decision-making.Pictures